Bivrost Cloud Portal
Visualize your well data in real-time!
Please watch our 1-minute video for a Bivrost-demo!
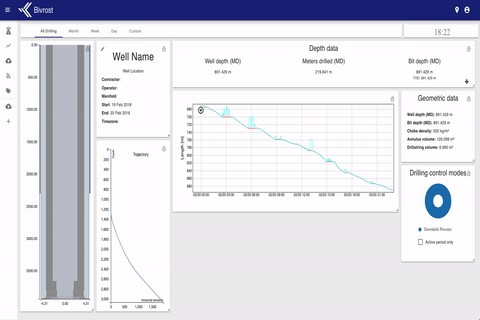
Bivrost is a tool for viewing, analyzing and handle all logged signals from a well. With an intuitive user interface, it is a low-threshold application for data visualization and uses cloud-storage to avoid monopolizing your computer disk space. Bivrost has a customizable dashboard that gives a fast overview of the current well. It shows real-time updated values of eg. well depth, bit depth, and drill string volume, as well as a visual representation of the well trajectory and an interactive chart of the well casing distribution.
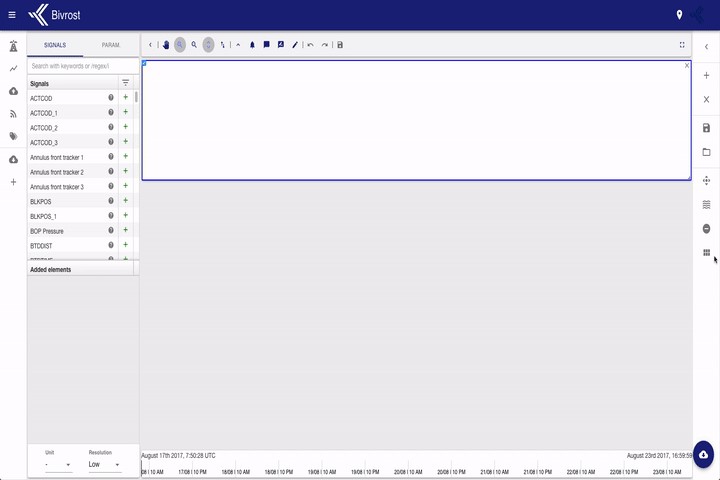
The plot-page allows you to generate multiple plots at a time, choosing either from a list of signals and parameters or selecting one of the built-in profiles. It is easy to choose your own preferred units, customize the plots in both size and appearance and save a current profile for quickly retrieving it at a later time. Plots can be exported for further handling in other software, or directly as images to use in reports or presentations. The tag-viewer lets you identify and sort based on operations and sub-operations.